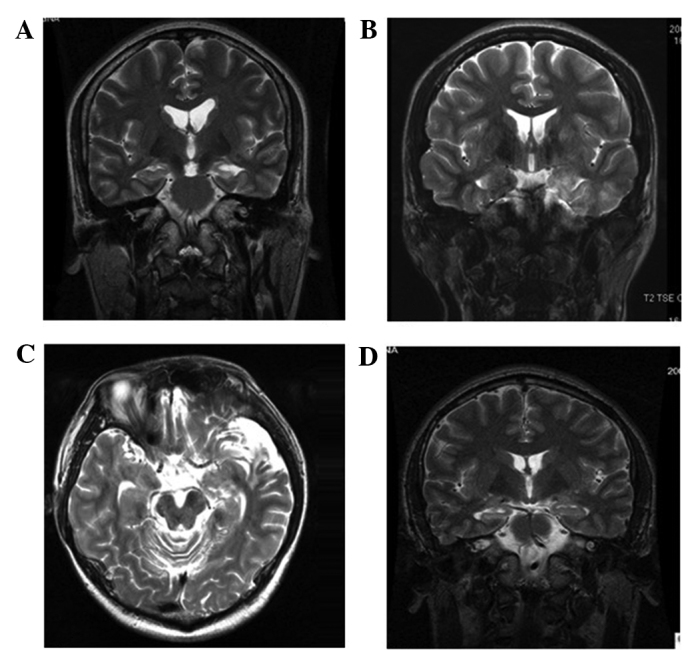
Figure 1.

Representative micrographs of magnetic resonance images showing hippocampal sclerosis or normal hippocampus. (A) Left hippocampus appeared atrophied and hyperintense on the T2-weighted images, which was diagnosed as hippocampal sclerosis (HS). (B) Cortical dysplasia in the left temporal lobe with left HS. (C) Cortical atrophy in the left temporal lobe with HS. (D) The temporal horn in the right lateral ventricle was expanded with a normal hippocampus.
