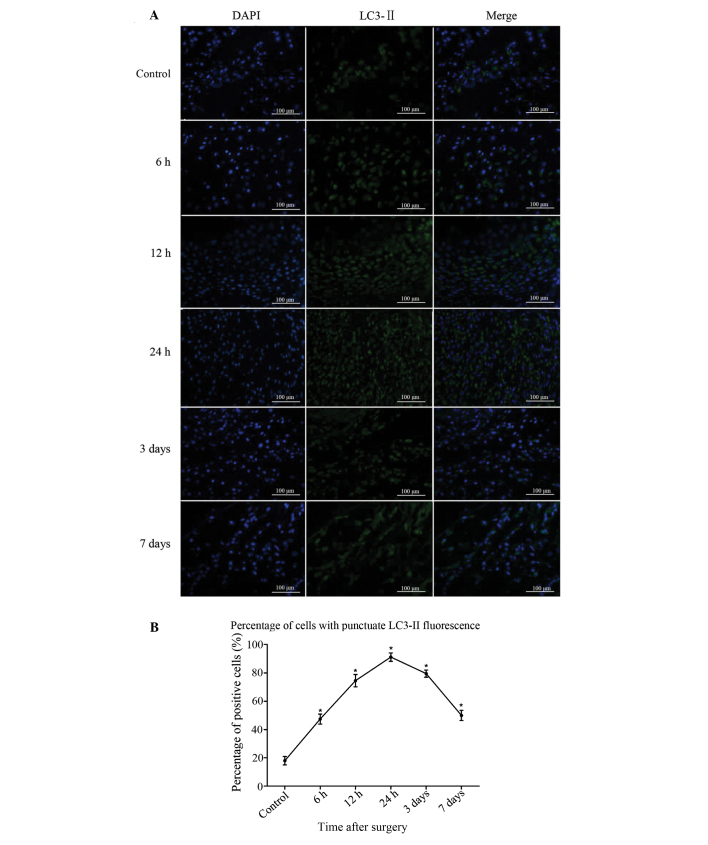
Figure 2.
Immunofluorescence staining of LC3-II in the bone tissue near the fracture site. (A) In the control group, LC3-II-positive cells were sparse; in the fracture group, the population of LC3-II-positive cells increased after 6 h, peaked at 24 h and then gradually decreased at 3 days. (B) Analysis of the percentage of cells in fracture-site tissue with punctuate LC3-II fluorescence. Results are presented as the mean ± standard deviation. *P<0.05 vs. control. Scale bar, 100 µm; magnification, ×400. LC3-II, microtubule-associated protein II light chain 3.

