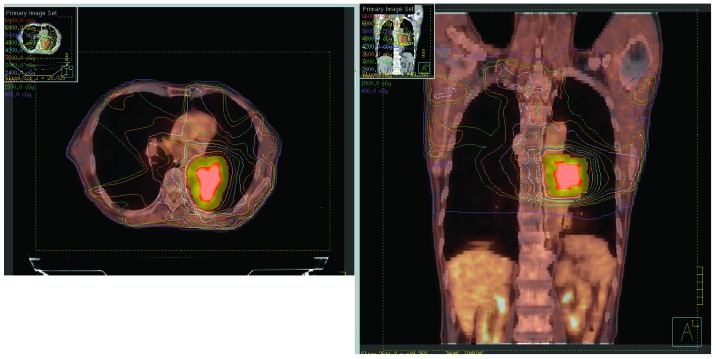
Figure 1.
Dose curves derived from 18F-fluorodeoxyglucose positron emission tomography/computed tomography image fusion with the treatment planning systems. The planning treatment volume receiving different doses are shown by different color isodose lines: 66 Gy (red), 60 Gy (yellow), 54 Gy (purple), 48 Gy (green), 42 Gy (light blue), 36 Gy (orange), 30 Gy (dark green), 24 Gy (gray), 18 Gy (orange), 12 Gy (dark green) and 4 Gy (purple).

