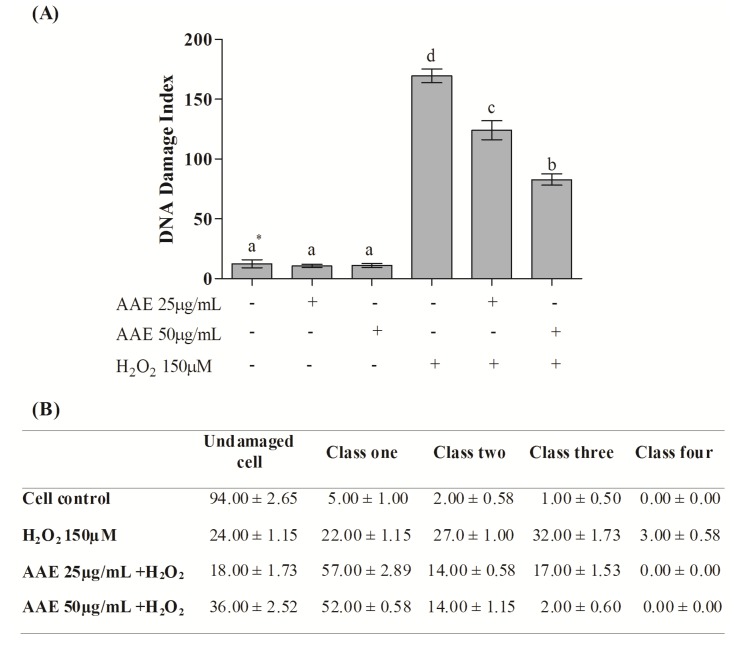
Figure 3.
(A) DNA damage index by the alkaline Comet assay in MRC5 cells after treatment with AAE and exposure to H2O2. * Different letters indicate significant differences by analysis of variance (ANOVA) and Tukey’s post-hoc test (p ≤ 0.05). (B) Frequency (%) of different classes of DNA damage in control and AAE-treated groups. The cells were assessed visually and received scores from 0 (no injury) to 4 (maximally damaged), according to the size and shape of the tail. Data are mean ± SD values.

