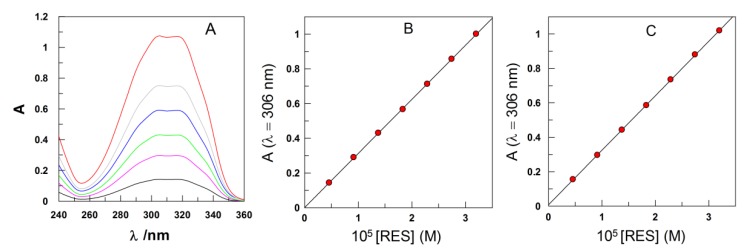
Figure 1.
(A) Spectra of RES in water at different [RES]; (B) Beer’s law plot for RES in water (A = (7 ± 27) × 10−4 + (31,187 ± 130) [RES]); (C) calibration curve in a 50:50 (vol:vol) EtOH/BuOH mixture containing 40 µL of corn oil (A = (7.6 ± 2) × 10−4 + (31,682 ± 106) [RES]). Correlation coefficients > 0.999.

