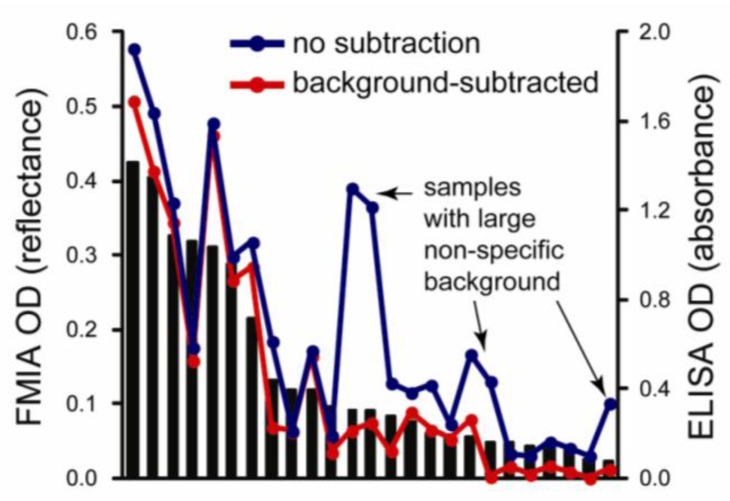
Figure S2.
Impact of background subtraction in the FMIA. The FMIA signals presented in Figure 3 included subtraction of background signal from unspotted (but blocked) regions of the membrane for each sample. The plot below reproduces the data from Figure 3 for FMIA (red) and ELISA (black bars) with additional overlay of FMIA signals without background subtraction (blue). If background subtraction was not performed, several samples deviated from ELISA due to large non-specific binding. Background subtraction in the FMIA accounted well for effects of non-specific binding.

