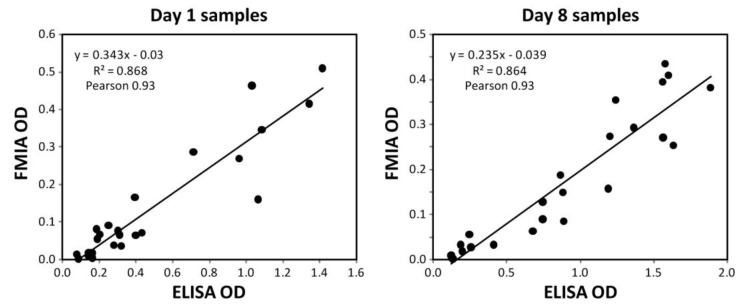
Figure S3.
Correlation plots for raw FMIA OD and raw ELISA OD data for Day 1 and Day 8 samples. Pearson correlation coefficients were 0.93 for Day 1 and Day 8 data sets. The increasing scatter at higher assay signals is expected for many assays; the error analysis in Figure 3 confirms that error scales with signal (i.e., constant CV; this is treated by applying the log-transformation in Figure 3). The best-fit correlation lines shown here were used to perform the linear scaling applied in Figure 3. Day 1 scaling resulting in Figure 3 data: scaled FMIA = (FMIA OD − 0.030) × 0.343; coefficient of determination 0.868. Day 8 scaling resulting in Figure 3 data: scaled FMIA = (FMIA OD − 0.039) × 0.235; coefficient of determination 0.864. Figure 3 in the text shows the linearly-scaled, log-transformed data; the plots below show the raw data.

