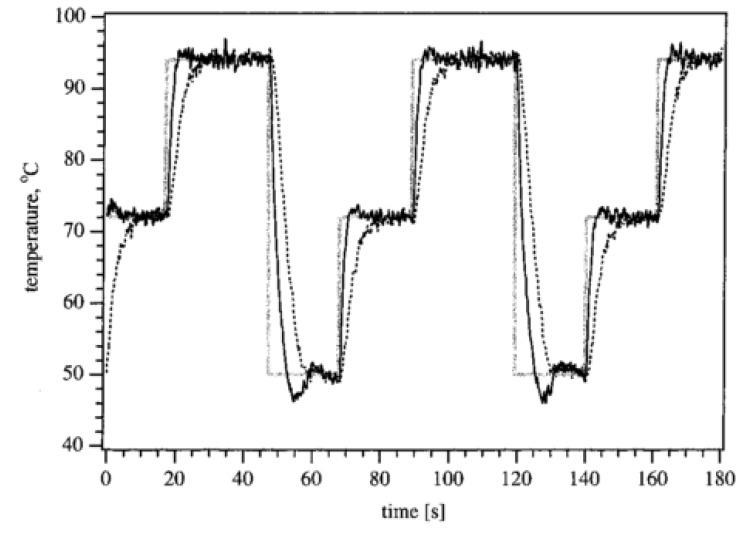
Figure 2.
Temperature versus time for Polymerase Chain Reaction (PCR) amplification. The gray solid line represents the set-point temperature, the black solid line is the temperature of the bottom Peltier element and the dashed line is the reaction mix temperature. Reprinted with permission from [4]. Copyright 2000 American Chemical Society.

