Figure 5.
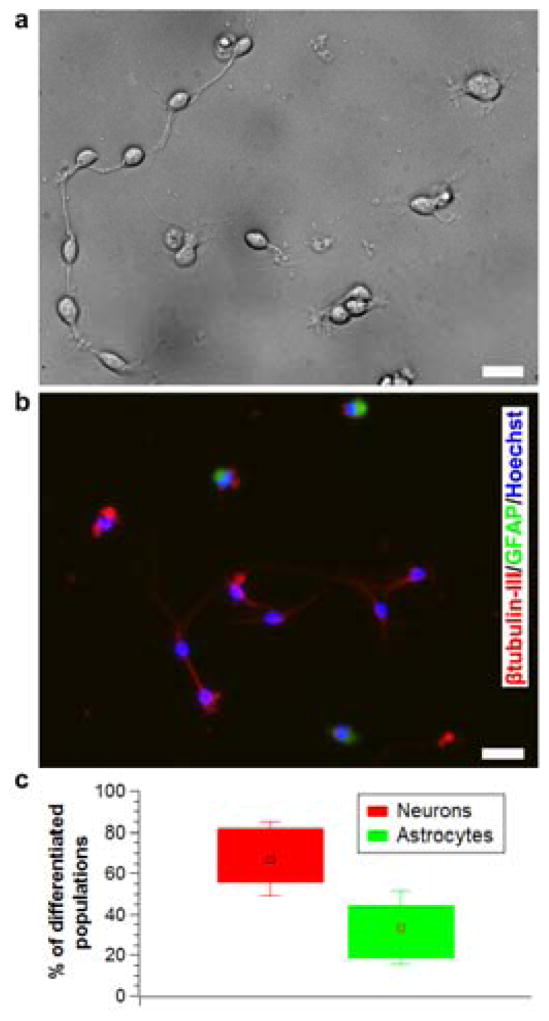
Immunostaining of sorted single cells to analyze preserved multipotency. a) Differential interference contrast image showing differentiation of sorted NSCs (Day 5). b) Immunofluorescence image showing both neurons (red) and astrocytes (green) in the differentiated population. (Figures a, b correspond to different experiments) c) Relative percentage of neurons and astrocytes produced from different experiments. (Data reported as mean ± standard deviation, n = 12). All scale bars = 20 μm.

