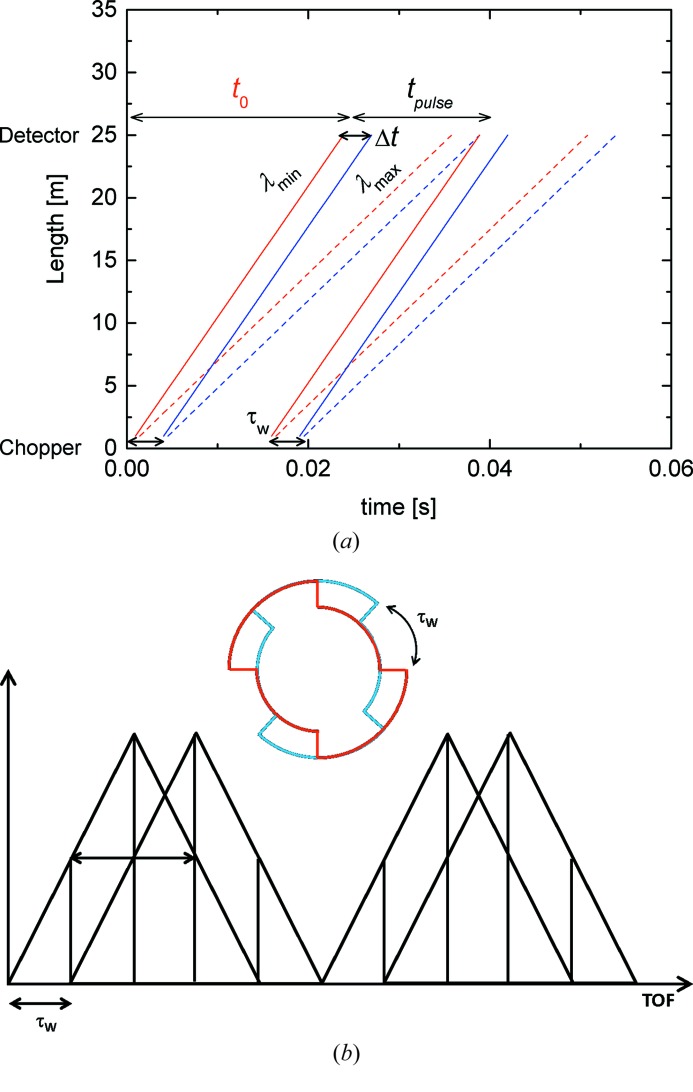
Figure 4.
The TOF diagram (a) and a schematic presentation of the time distribution and splitting of the double pulse emitted per cycle and collected within the TOF window set for the detector (b) for the setup corresponding to Δλ/λaim = 10%: L D = 4 m, λ = 4.72 Å, f chopper = 34 Hz, Δφ = 36°; τw = 0.0029 s. To reach the Δλ/λaim each pulse must be split into five TOF slots. The two partially overlapping triangles which are shown in (b) represent the distribution of neutrons from the opening and closing edges of the chopper.

