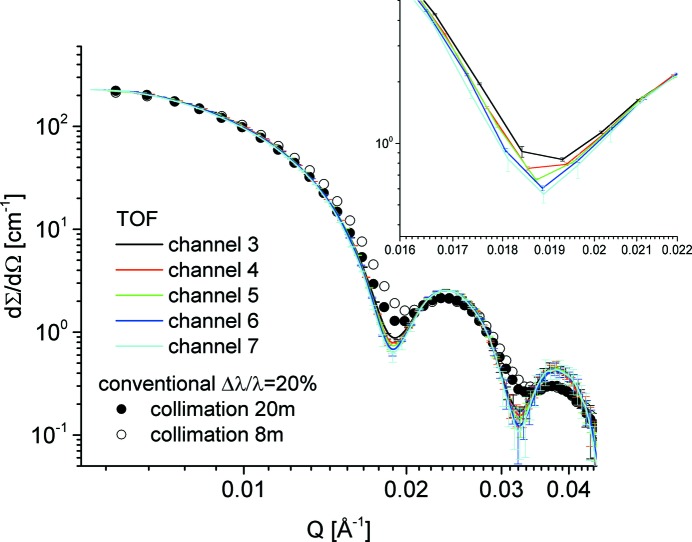
Figure 8.
SANS curves of SiO2 particles in d-DMF measured at KWS-2 with different resolutions; symbols – data collected with the conventional (continuous) mode by varying the collimation length L C; lines – data collected with the TOF mode using the chopper adjusted for Δλ/λaim = 5% (see details in text) as recorded in different time slots (channels). The inset shows the first minimum in the form factor.

