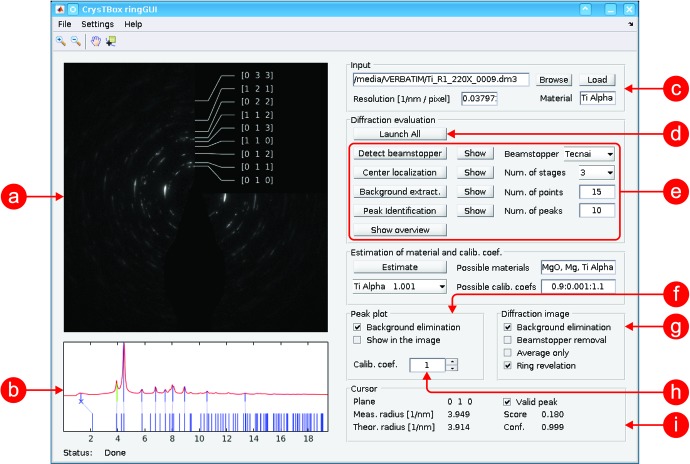
Figure 3.
User interface of ringGUI. (a) Visualization of partial and final results in the input image; (b) visualization of assignment between measured peaks/rings (top) and theoretical d-spacing values (bottom); (c) input image details; (d) button launching the whole analysis; (e) buttons launching individual steps of the analysis procedure and basic settings; (f) settings of the peak plot; (g) instruments for enhancement of the input image; (h) calibration coefficient; (i) details about the peak/d spacing selected in the peak plot.

