
FIGURE 5.
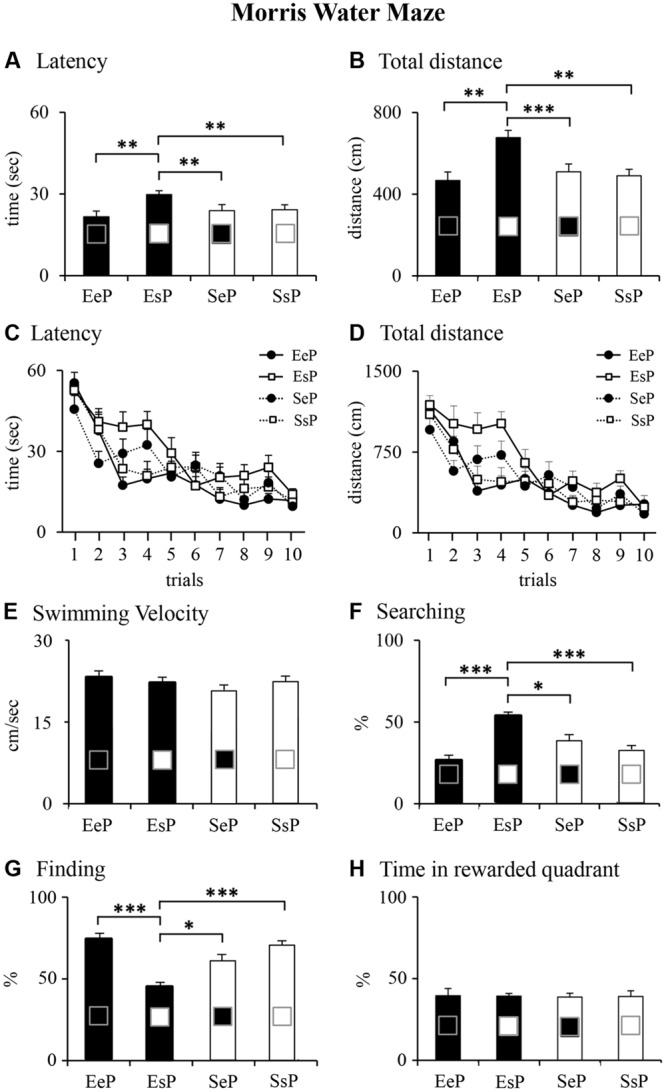
Results of pre-reproductive maternal enrichment and fostering manipulations on offspring spatial performances: histograms show latency (A,C), total distance (B,D) swimming velocity (E), and navigational strategies put into action (Searching, F; Finding, G) throughout MWM test, and percentage of time spent in the previously rewarded quadrant during Probe phase (H) of EeP, SsP, EsP, and SeP rats (∗p < 0.05, ∗∗p < 0.01, ∗∗∗p < 0.001).