
FIGURE 6.
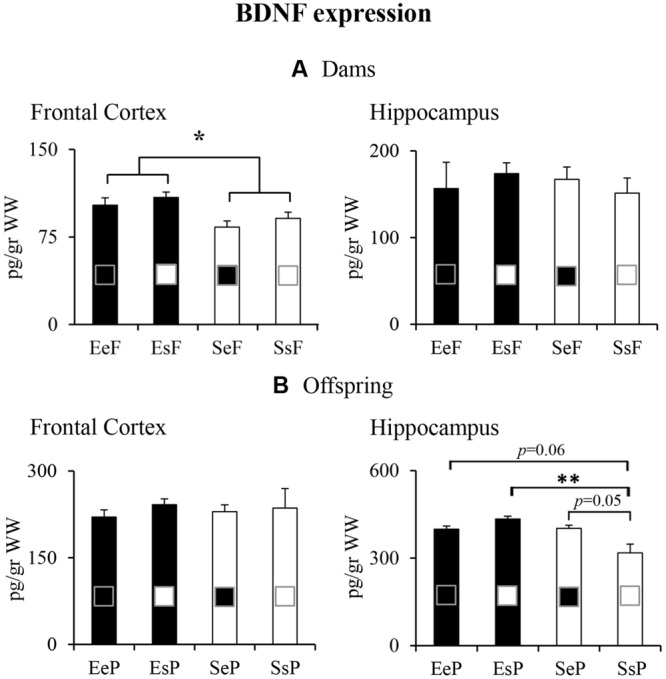
Results of pre-reproductive maternal enrichment and fostering manipulations on BDNF expression: histograms show BDNF expression levels analyzed in frontal cortex and hippocampus of EeF, SsF, EsF, and SeF dams (A), and of EeP, SsP, EsP, and SeP offspring (B) (∗p < 0.05, ∗∗p < 0.01).