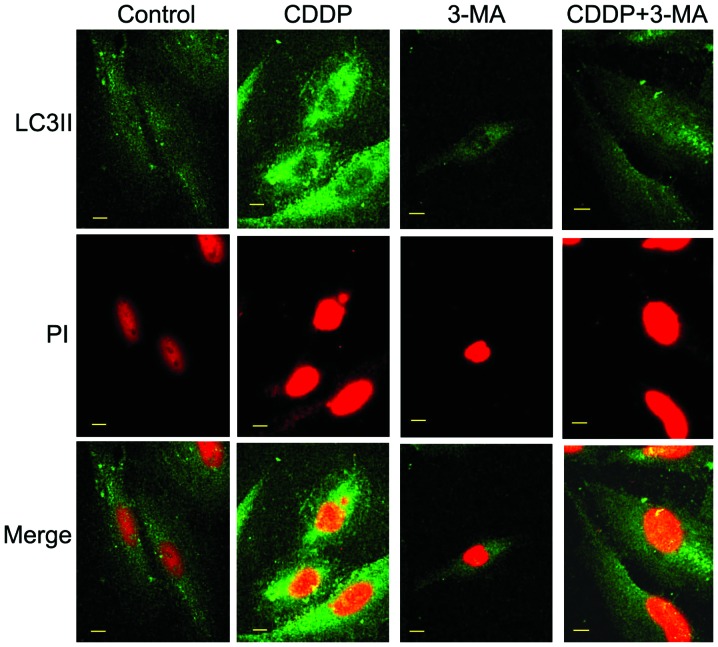
Figure 2.
Representative confocal microscopy images of LC3II expression in MG63 cells. LC3II was detected using an anti-LC3II primary antibody and a fluorescein isothiocyanate-conjugated secondary antibody. The appearance of chromatin was indicated by propidium iodide staining. Green color represents localization of LC3II, which indicates autophagic activity. Red color represents localization of nuclei. Following 24 h of culture with no drug (control), MG63 cells demonstrated few autophagic changes. Treatment with 10 µg/ml CDDP significantly increased these changes. Treatment with 3-MA (6 mM) partially inhibited the expression of LC3II in MG63 cells. Co-treatment with CDDP (10 µg/ml) and 3-MA (6 mM), resulted in downregulated fluorescence intensity of LC3II compared with that of cells treated with CDDP alone. Scale bar, 10 µm. LC3II, microtubule-associated protein light chain 3II; CDDP, cisplatin; 3-MA, 3-methyladenine; PI, propidium iodide.

