Figure 4.

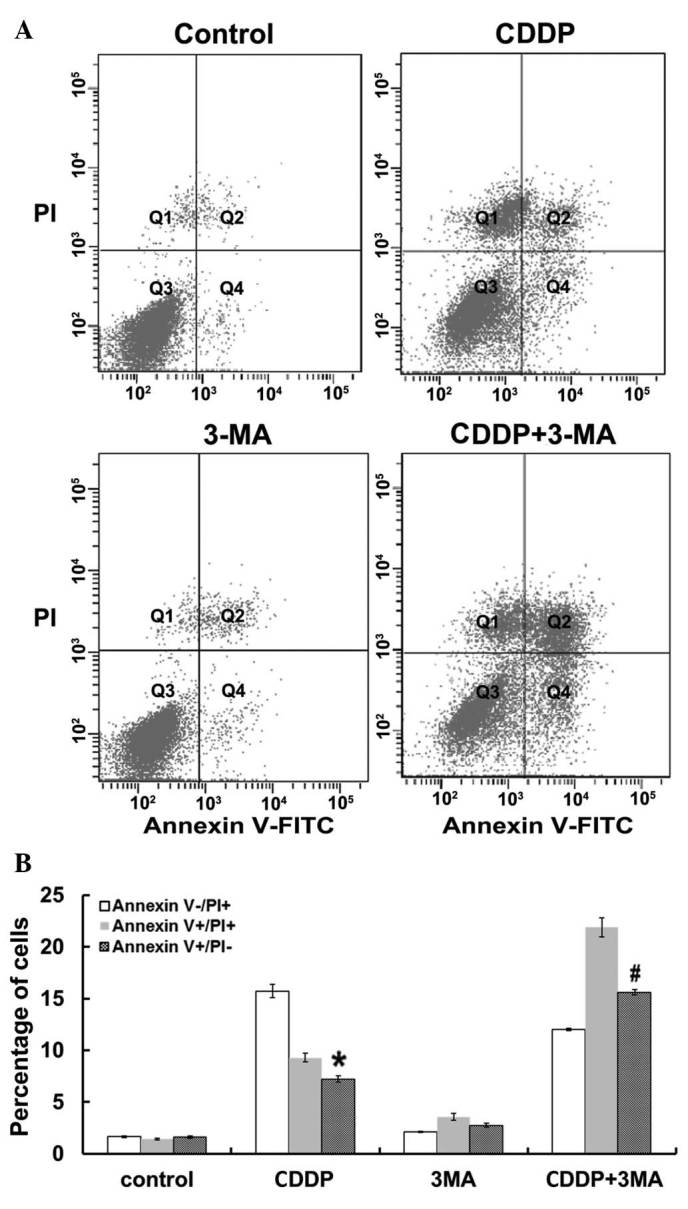
Flow cytometric analysis of MG63 cell apoptosis. (A) Representative plots of Annexin V vs. PI fluorescence for control cells and cells treated with CDDP, 3-MA and CDDP + 3-MA for 24 h. Q1, Annexin V−/PI+, damaged cells; Q2, Annexin V+/PI+, necrotic cells; Q3, Annexin V−/PI−, viable cells; and Q4, Annexin V+/PI−, apoptotic cells. (B) Percentage of cells labeled with Annexin V+/PI− (apoptotic cells), Annexin V−/PI+ (damaged cells) and Annexin V+/PI+ (necrotic cells) following 24 h of treatment. Data are presented as the mean ± standard error. CDDP significantly increased the percentage of Annexin V+/PI− (apoptotic cells) compared with that of control cells (*P<0.05). 3-MA + CDDP co-treatment significantly increased the percentage of Annexin V+/PI− (apoptotic cells) compared with that of cells treated with CDDP alone (#P<0.05). There was no significant difference between the untreated control and 3-MA groups (P>0.05). PI, propidium iodide; CDDP, cisplatin; 3-MA, 3-methyladenine; FITC, fluorescein isothiocyanate.
