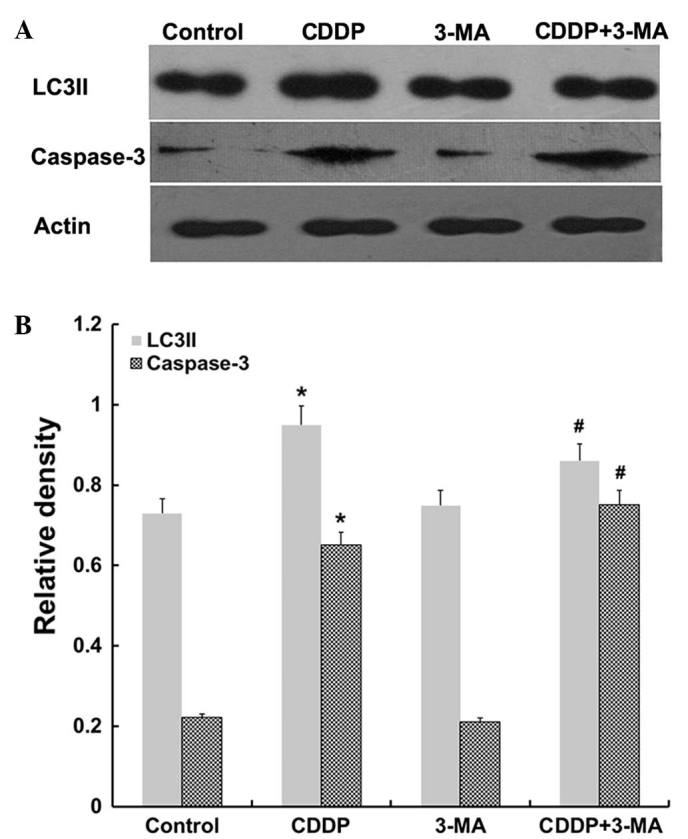
Figure 5.

LC3II and caspase-3 expression in MG63 cells. (A) Western blot analysis of LC3II and caspase-3 expression in the cell populations. The expression of LC3II and caspase-3 proteins was increased following CDDP treatment (*P<0.05), while combined CDDP + 3-MA treatment downregulated the expression of LC3II and upregulated the expression of caspase-3 (#P<0.05). There was no significant difference between the control and 3-MA groups (P>0.05). Data are expressed as the mean ± standard error. LC3II, microtubule-associated protein light chain 3II; CDDP, cisplatin; 3-MA, 3-methyladenine.
