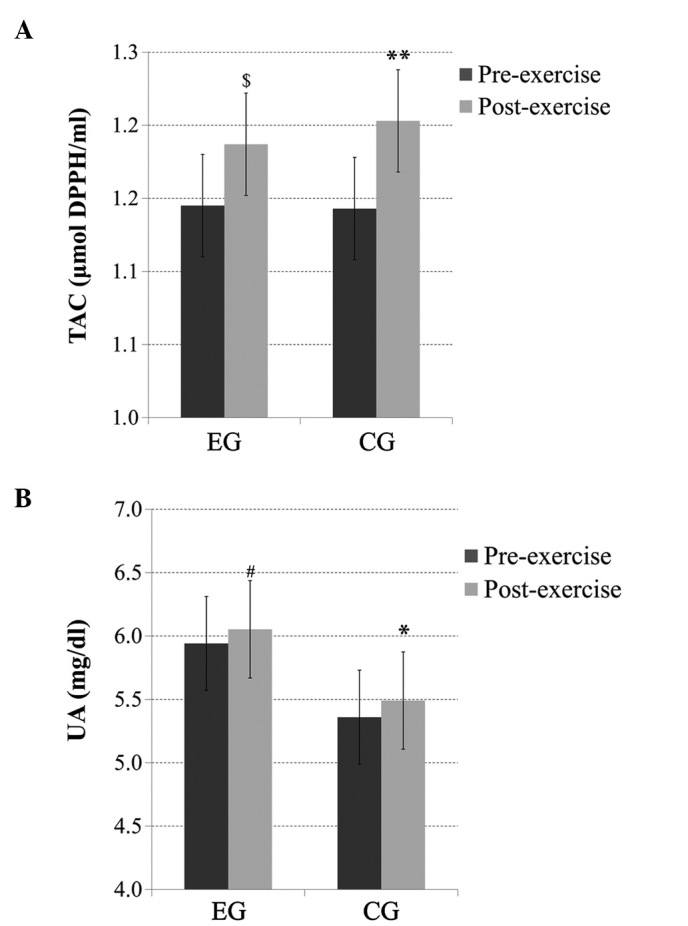
Figure 3.

(A) Total antioxidant capacity (TAC) and (B) uric acid (UA) levels before and immediately after acute exercise in heavy drinkers [experimental group (EG)] and the control group (CG). *Significantly different from the pre-exercise value in the same group (p<0.05); **significantly different from the pre-exercise value in the same group (p<0.01); #significantly different from the pre-exercise value in the same group (p=0.08); $significantly different from the pre-exercise value in the same group (p<0.06).
