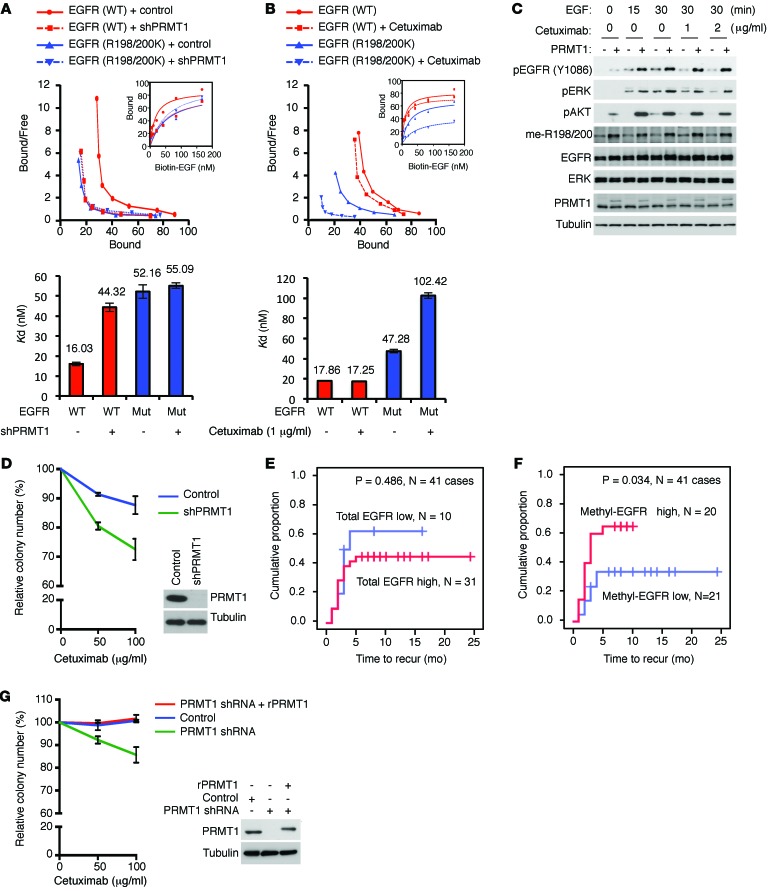
Figure 6. EGFR methylation regulates EGF binding to EGFR and correlates with higher recurrence rate of colorectal cancer patients after cetuximab treatment.
(A) Top: Scatchard plot and binding curves (inset), which measured EGFR-EGF binding affinity of HT29 cells expressing WT or R198/200K mutant (Mut) EGFR with or without knocking down of PRMT1. Bottom: Bar graph of Kd values. Red, WT EGFR; blue, R198/200K mutant EGFR. (B) Top: Scatchard plot and binding curves (inset), which measured EGFR-EGF binding affinity of HT29 cells expressing WT or R198/200K mutant EGFR with or without cetuximab treatment. Bottom: Bar graph of Kd values. Red, WT EGFR; blue, R198/200K mutant EGFR. Data are expressed as mean ± SD. (C) Immunoblot assessing EGFR, ERK, and AKT activation levels of HT29 cells expressing control vector or PRMT1 upon EGF stimulation in the presence or absence of cetuximab. (D) Clonogenic assay of HT29 cells expressing control vector or PRMT1 shRNA under cetuximab treatment (n = 3). Data are expressed as mean ± SD. Expression levels of PRMT1 shown by immunoblot. Data shown are representative of 4 independent experiments. (E) Kaplan-Meier plot of recurrence rate of 41 colorectal cancer cases with WT KRAS treated with cetuximab with low or high total EGFR level. (F) Kaplan-Meier plot of recurrence rate of 41 colorectal cancer cases with WT KRAS treated with cetuximab with low or high methyl-EGFR level detected by me-R198/200 Ab. P < 0.05 using Student’s t-test. (G) Clonogenic assay of SKCO1 cells expressing control vector or PRMT1 shRNA, or reexpressing shRNA-resistant PRMT1 under cetuximab treatment (n = 5). Data are expressed as mean ± SD.

