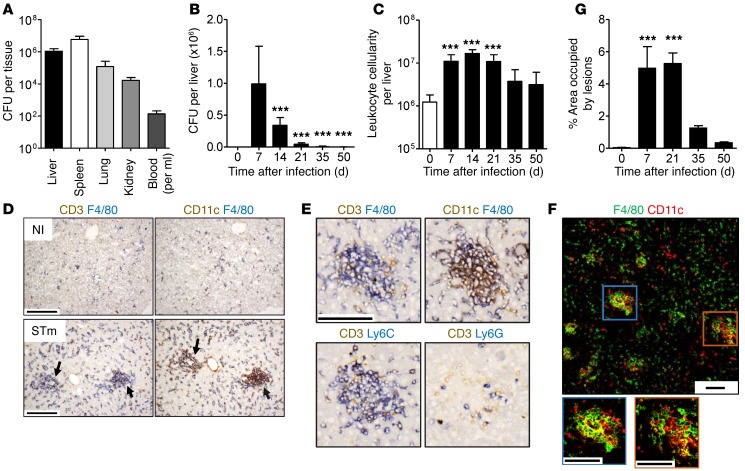
Figure 1. Inflammatory foci develop in the liver during S. Typhimurium infection.
WT mice were infected i.p. with 5 × 10⁵ CFU S. Typhimurium (STm). (A) Bacterial colonization 7 days after infection. (B) Bacterial colonization of the liver. (C) Number of leukocytes isolated from the liver. (D) Noninfected (NI) and day 7–infected serial liver sections stained by IHC for F4/80 (blue), CD3 (brown); and F4/80 (blue), CD11c (brown). Arrows indicate inflammatory lesions. (E) Serial sections of a lesion stained for F4/80 (blue), CD3 (brown); F4/80 (blue), CD11c (brown); Ly6C (blue), CD3 (brown); and Ly6G (blue), CD3 (brown). (F) Fluorescent confocal microscopy image of day 7–infected liver stained for F4/80 (green) and CD11c (red). (G) Percentage area of liver occupied by inflammatory lesions quantified by point counting. Graphs show mean + SD. Data are representative of a minimum of 3 experiments, where n ≥ 4 mice in each group. Statistical significance (1-way ANOVA with Dunnett’s test) was determined relative to day 7 after infection (B) or relative to noninfected mice (C and G). ***P ≤ 0.001. Scale bars: 100 μm.

