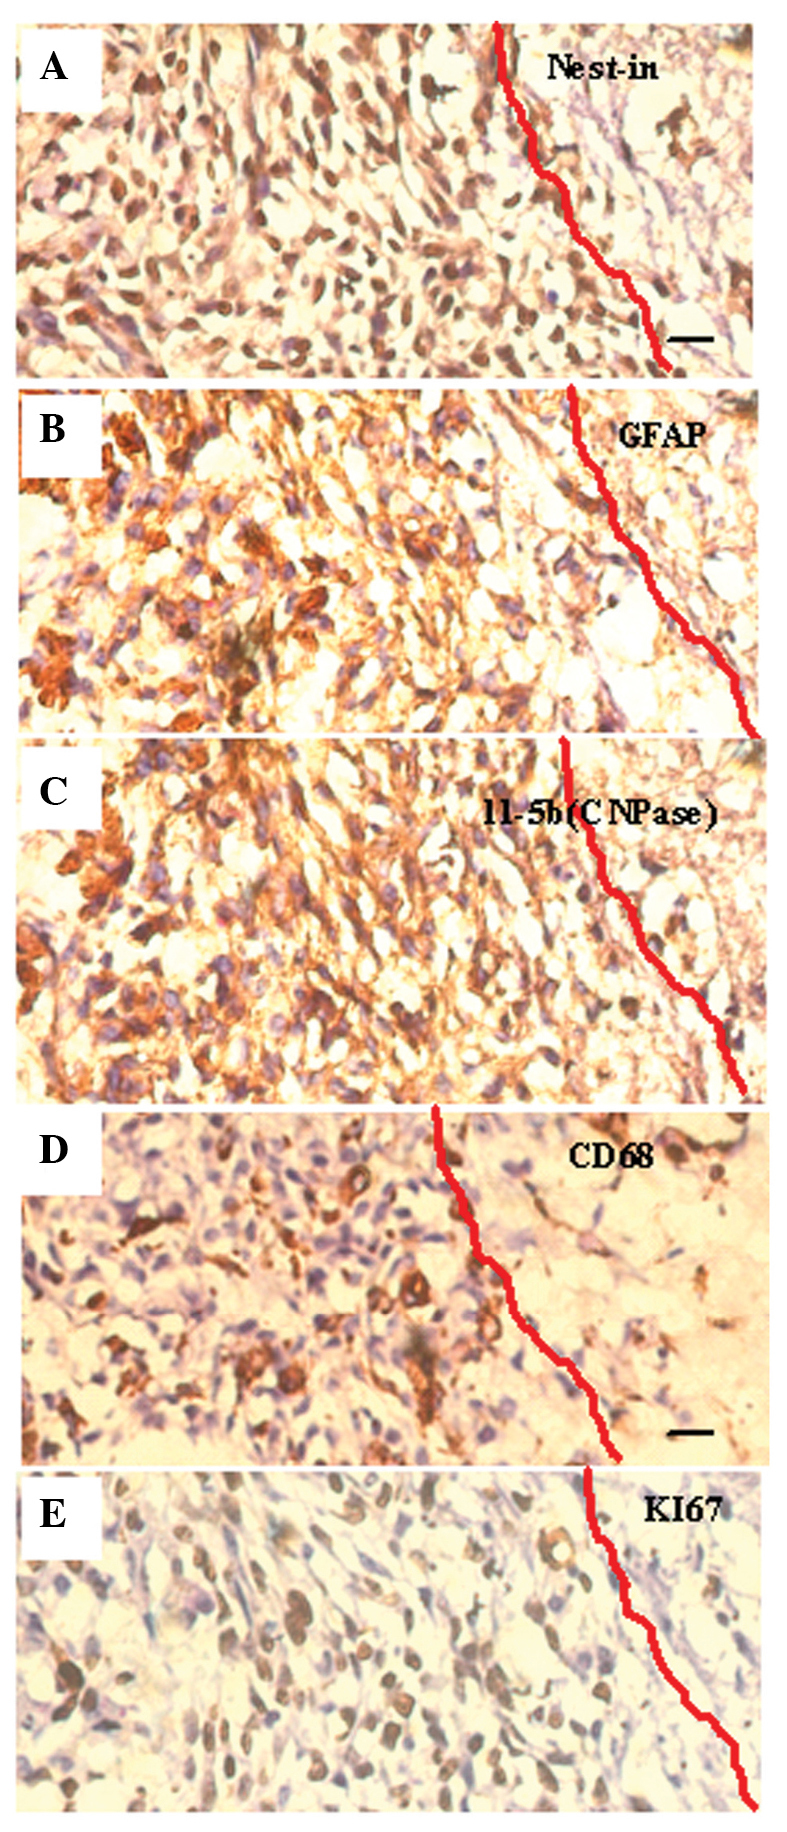
Figure 8.

Identification of the cell (SU3) type via visualization of protein markers in the stress reaction zone surrounding the tumor (immunohistochemistry dyeing from contiguous slices of the same specimen; scale bar, 20 µm): (A) Nestin, expressed predominantly in the cytoplasm (brown immunocomplex), identified neuroglia precursor cells; (B and C) astrocyte-related glial fibrillary acidic protein (GFAP, B) and oligodendrocyte-related phosphodiesterase (CNPase, C) were expressed in the cytoplasm of some of the cells (brown immunocomplex); (D) Monocyte/macrophage associated CD68+ cells distributed in the reaction zone between cells (brown immunocomplexes); (E) the proliferation cell nuclear antigen Ki67 (brown immunocomplex expressed in karyons)-positive cells formed ~80% of all cells, and this suggested that the majority of cells were undergoing proliferation, regardless of the numerous cellular types.
