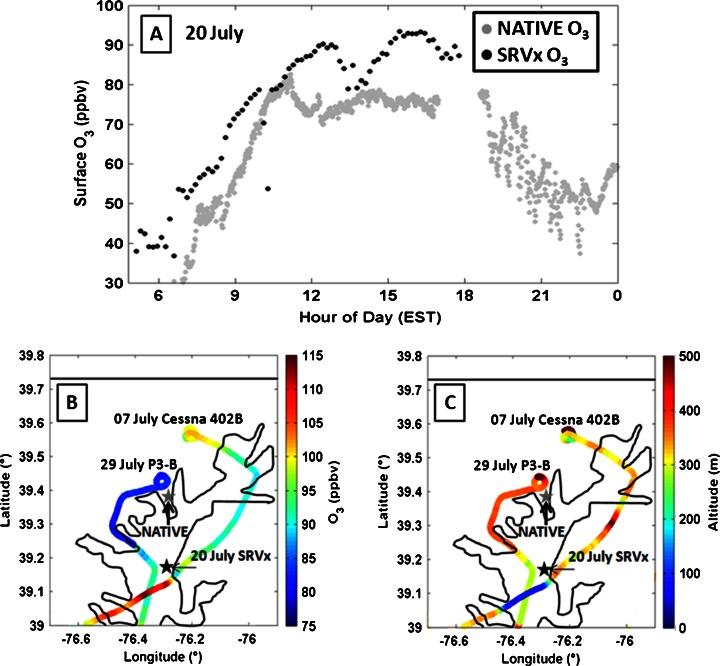
Fig. 4.
Surface O3 on the SRVx (a, black dots, averaged to 10 min) and at NATIVE (a, grey dots), O3 from the NASA P3-B and UMD Cessna 402B (b, colors) and flight altitude (c, colors) for three different days. SRVx surface O3 (a) was taken on 20 July and flights (b, c) are 07 July for the UMD Cessna, and 29 July for the NASA P3-B. Downward spikes in SRVx O3 measurements are likely O3 titration in fresh NO plumes from the ship’s engine exhaust

