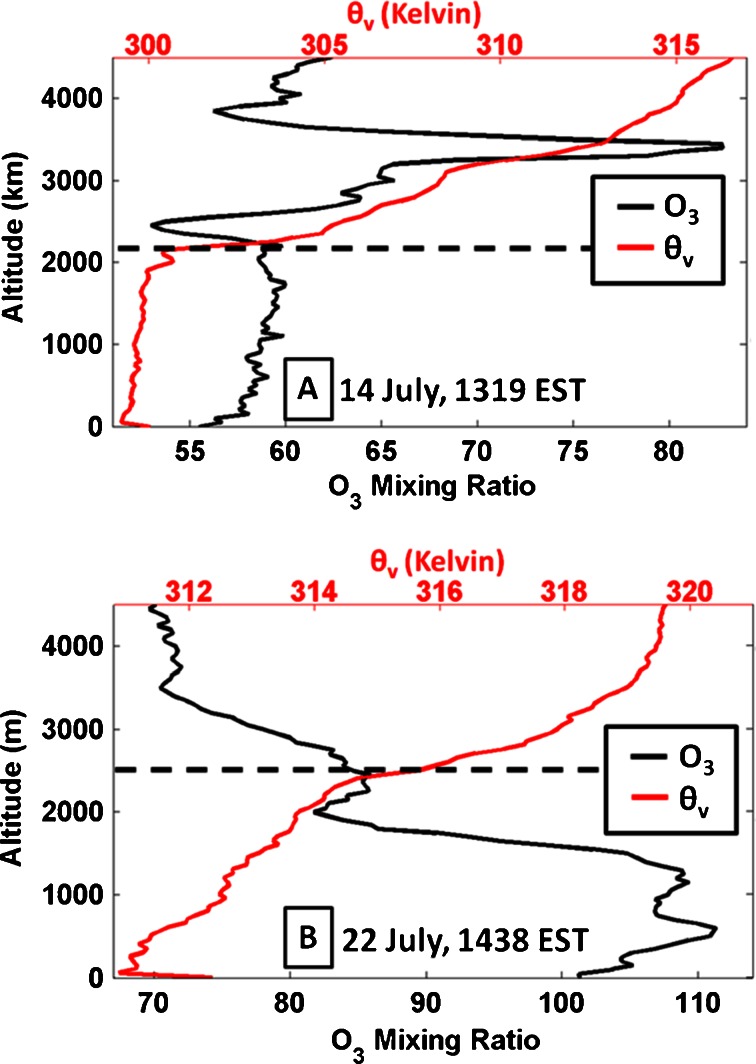
Fig. 6.
Surface to 4.5 km profiles of O3 (black) and virtual potential temperature (red) from two ozonesonde flights on 14 July (a) and 22 July (b). 22 July was an “interrupted” day with the bay breeze regaining strength in the afternoon and evening hours after a midday thunderstorm. Horizontal dashed lines mark the estimated tops of the boundary layer using the Heffter (1980) method. Launch times are noted on each profile and data are bin-averaged every 50 m

