
Figure 3.
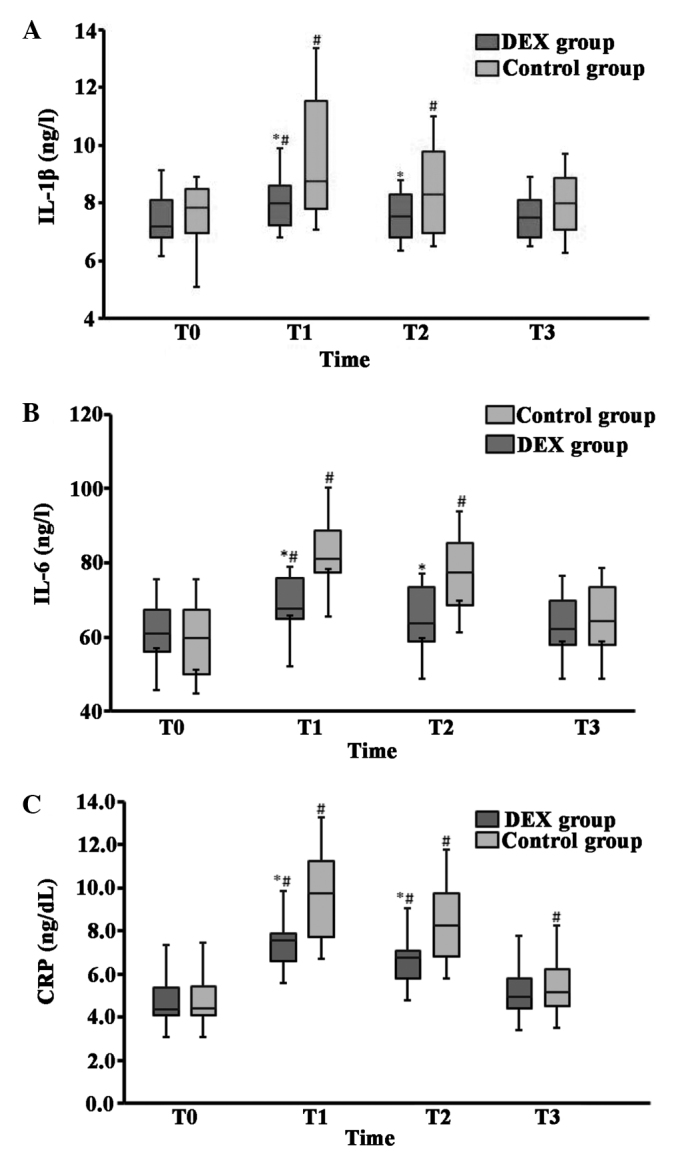
Comparison of cytokine (A) IL-1β, (B) IL-6 and (C) CRP concentrations between the DEX and control groups. The box-plots display interquartile range (box), the median (line in the middle of the box) and 10th and 90th percentiles (error bars). *P<0.05 vs. the control group. #P<0.05 vs. baseline (T0). T0, prior to induction of anesthesia; T1, 6 h after surgery; T2, 1 day after surgery; T3, 2 days after surgery. DEX, dexmedetomidine; IL, interleukin; CRP, C-reactive protein.