Figure 2.
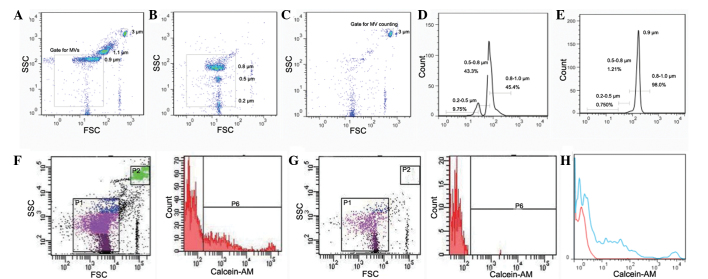
Gating and counting strategy. Representative dot plots and histograms illustrate gating and counting strategy for flow cytometric analysis of MVs. (A) 1 µm (a mixture of 0.9 and 1.1 µm) beads from Sigma-Aldrich were used to set the MV gate and establish appropriate instrument settings. The MV gate was defined as <1.0 µm. (B) A small bead calibration kit was used to verify the resolution capabilities of the flow cytometer, and to define the size distribution of MVs. (C) Representative dot plot for the 3-µm beads used for MV counting. (D) Histogram of size distributions from the data in Fig. 2B. (E) Histogram of size distribution from the data in Fig. 2A, verifying the applicability of Fig. 2D. (F) Representative sample of MV counting from the same individual as for the data in Fig. 2G. (G) An individual sample of MVs without calcein-AM staining was used as the calcein-AM negative control. (H) Histogram of the data in Fig. 2F, normalized against Fig. 2G. Red lines indicate data from Fig. 2G and blue lines indicate data from Fig. 2F. SSC, side scatter; FSC, forward scatter.

