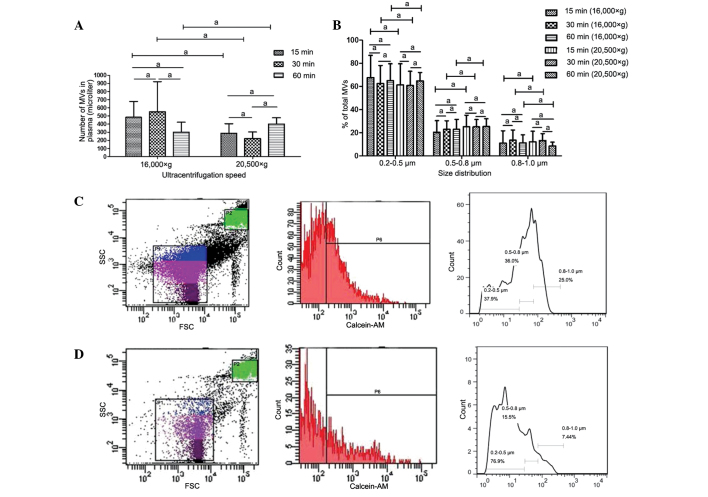
Figure 3.
Impact of centrifugation speed and duration on MV counts and size distribution. Differences in (A) MV count and (B) size distribution, respectively. Also, representative dot plot and histogram showing the effects of centrifugation speed on MV count and size distribution for samples from a single individual are presented: (C) Samples centrifuged at 20,500 × g; and (D) samples centrifuged at 16,000 × g. Data are expressed as the mean ± standard error of the mean. aNo statistically significant difference. MV, microvesicle; SSC, side scatter; FSC, forward scatter.

