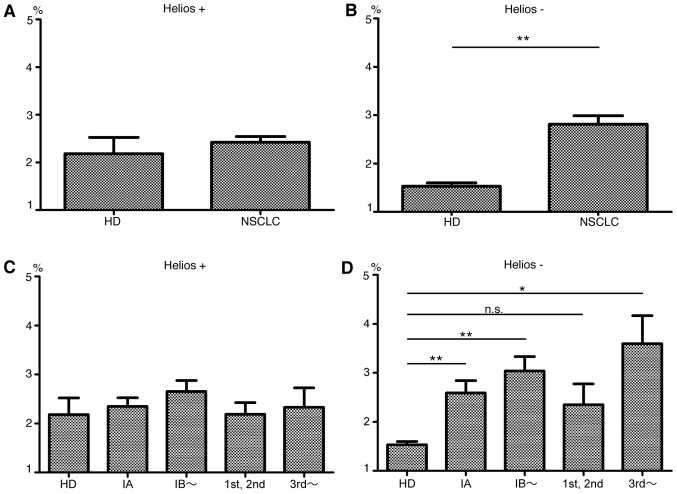
Figure 3.
Rates of Helios+ Foxp3+, Helios− Foxp3+ cells among CD4+ T cells of HD and NSCLC. Data of HD and NSCLC patients in panels (A and B) were divided into four groups: preoperative stage IA; preoperative stage ≥IB; 1st or 2nd line chemotherapy; and ≥3rd line or more chemotherapy for recurrence in panels (C and D), respectively. Mean ± SEM. HD, healthy donors; NSCLC, non-small cell lung cancer patients; *P<0.05; **P<0.01.

