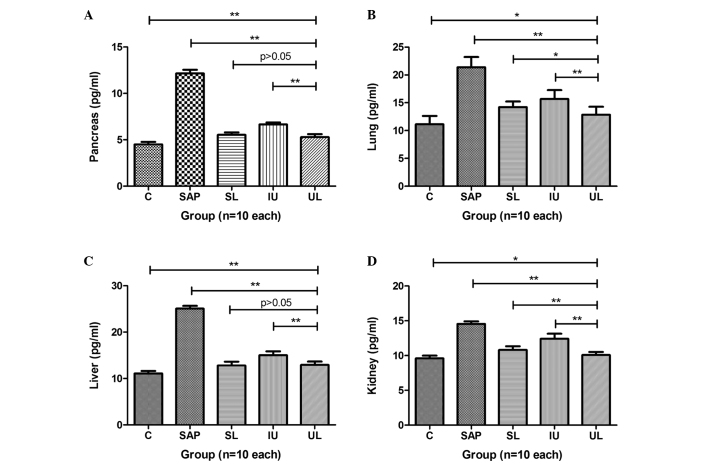
Figure 2.
Comparison of different treatments on the expression levels of TNF-α in the (A) pancreas, (B) lung, (C) liver and (D) kidney. The expression levels of TNF-α in multiple organs were greatly increased in group SAP compared with those in group C. The treatments administered to groups SL, IU and UL all significantly decreased the expression levels of TNF-α in multiple organs compared with those in group SAP and group UL exhibited the greatest reduction in expression levels. *P<0.05, **P<0.01. C, control; SAP, severe acute pancreatitis; SL, saline lavage; IU, intravenous ulinastatin; UL, ulinastatin lavage; TNF-α, tumor necrosis factor-α.

