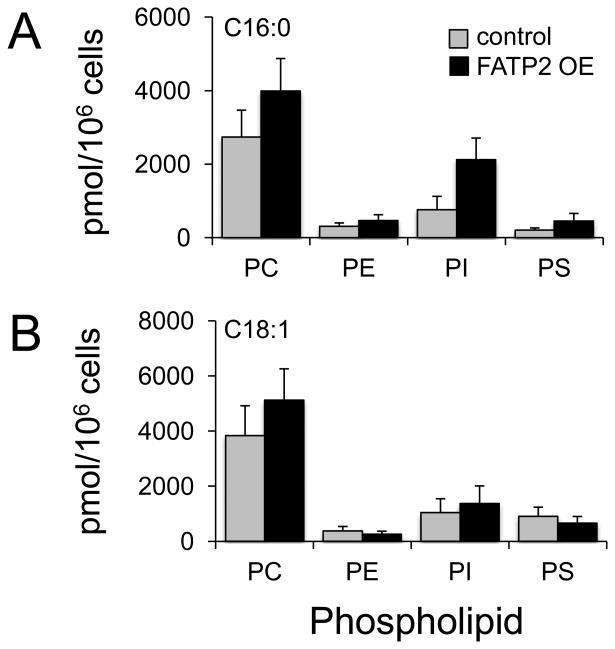
Figure 2. Trafficking of isotopically labeled saturated and monounsaturated fatty acids into the major classes of phospholipids in HEK293 cells expressing FATP2 (FATP2 OE).
FATP2 OE or control cells were labeled individually (50µM) with 13C16:0, or 13C18:1 for 4h, and isotopically labeled phosphatidylcholine (PC), phosphatidylethanolamine (PE), phosphatidylinositol (PI), and phosphatidylserine (PS) determined using ESI/MS as detailed under “Experimental Procedures;” C16:0 (A), C18:0 (B), and C18:1 (C). The error bars represent the standard error of the mean (n=4). *, p ≤ 0.05 relative to the vector control (paired t test).

