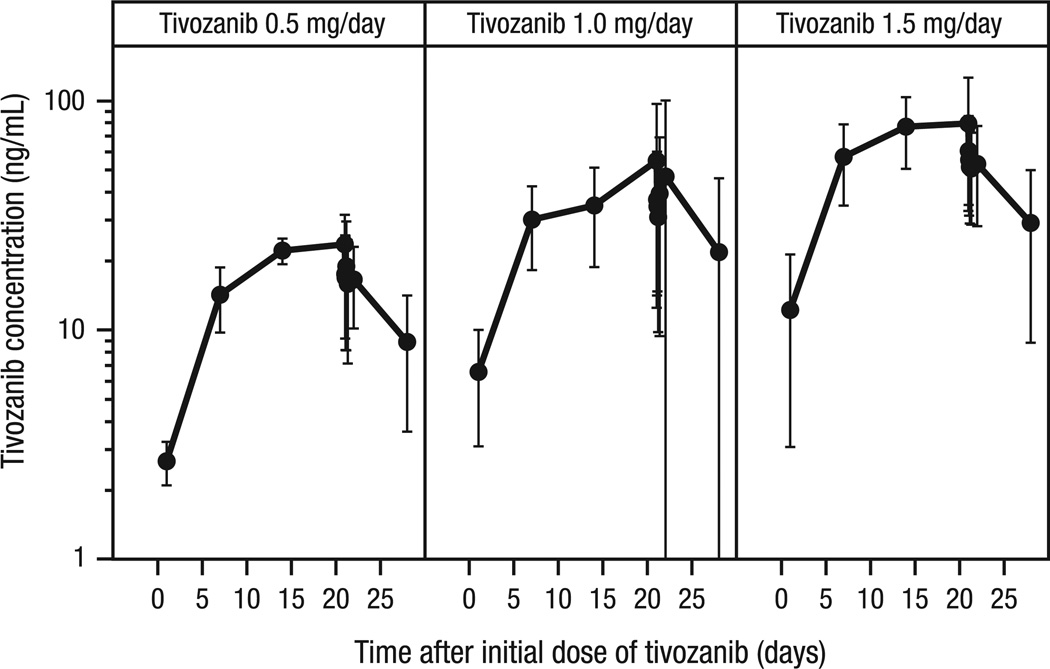
Fig. 4.
Individual and mean (shown in bold) tivozanib (1.5 mg) serum concentration versus time by dose level throughout cycle 1. Although substantial individual variation was observed, there was a clear relationship between tivozanib concentration and dose, and an accumulation of tivozanib to nearly steady-state levels over the 21-d treatment period.

