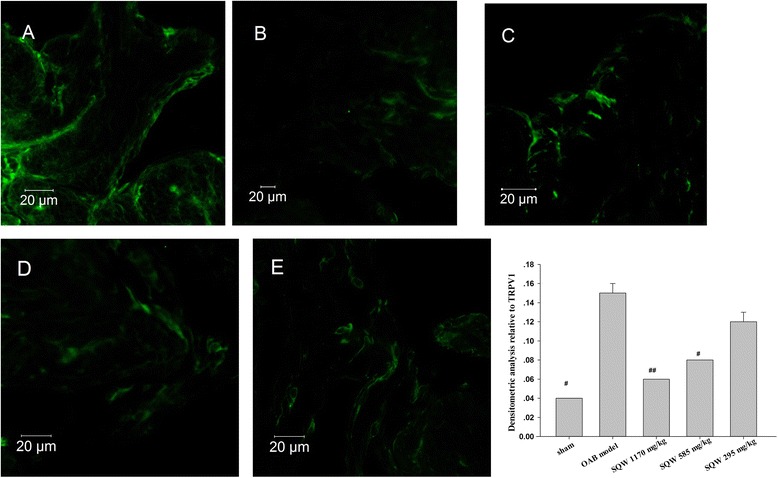
Fig. 5.

Inmunofluorescence staining used Laser Confocal Scan Analysis of TRPV1 in Bladder. a: OAB model group. b:sham group, c: SQW treated high group (treated with SQW at 1170 mg/kg/day), d: SQW treated middle group (treated with SQW at 585 mg/kg/day) and e: SQW treated low group (treated with SQW at 293 mg/kg/day). The last figure is densitomric analysis relative to TRPV1 of each group. Values are expressed as mean ± SEM. # = P < 0.05, ## = P < 0.01 vs OAB model group
