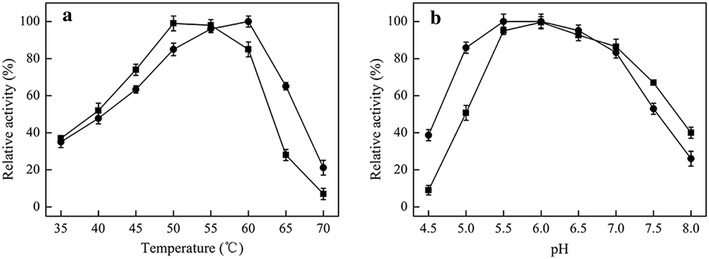
Fig. 1.

Effects of temperature and pH on the initial reaction rates of Bgl6 (filled square) and mutant M3 (filled circle). a The effects of temperature were measured at 50 °C. b The effects of pH were measured at pH 6.0. Data points are the average of triplicate measurements, and error bars represent standard deviation
