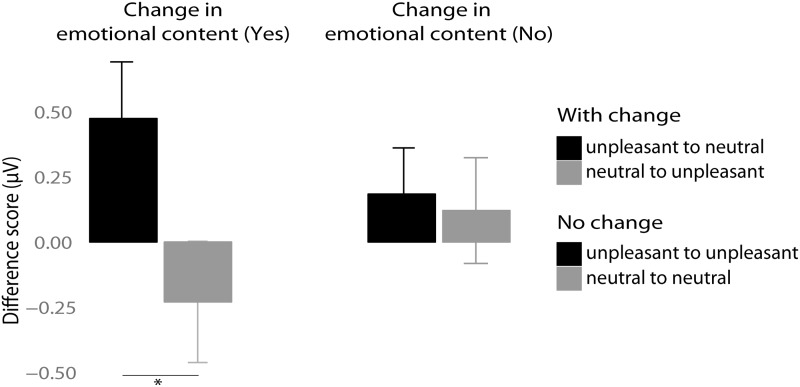
Fig. 6.
Mean amplitude difference values (first minus second time window) for 6 Hz SSVEP in microvolts. Left panel: Trials with a change in emotional content. Right panel: Trials without a change in emotional content. Error bars represent 95% CIs. Significant change corresponding to P-value < 0.01 is marked with *.

