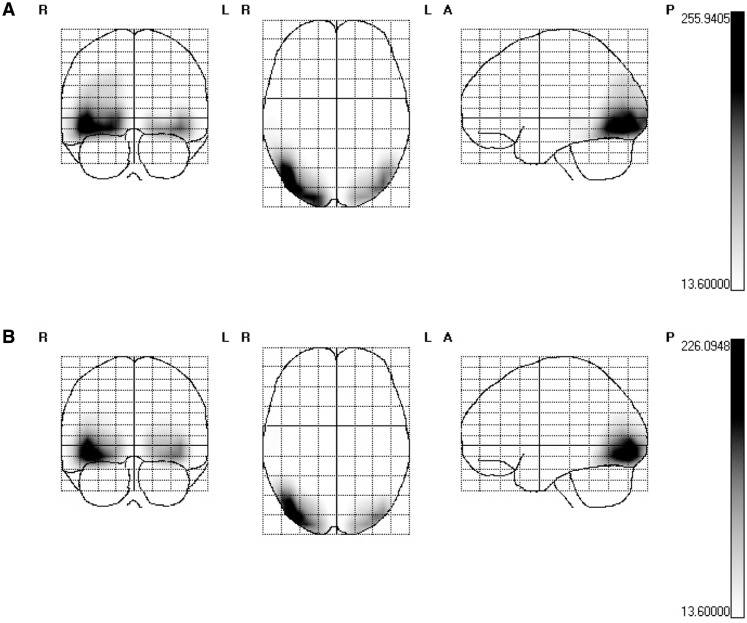
Fig. 7.
SPMs of the 6 Hz SSVEP estimated cortical current source-density distributions. The scale represent t-values, the threshold 13.6 corresponds to P < 0.001 and was Bonferroni corrected for multiple comparisons. (A) SPMs of the 6 Hz averaged across all conditions (B) SPMs of the contrast between unpleasant and neutral time windows (all unpleasant time windows tested against neutral time windows in the experiment).

