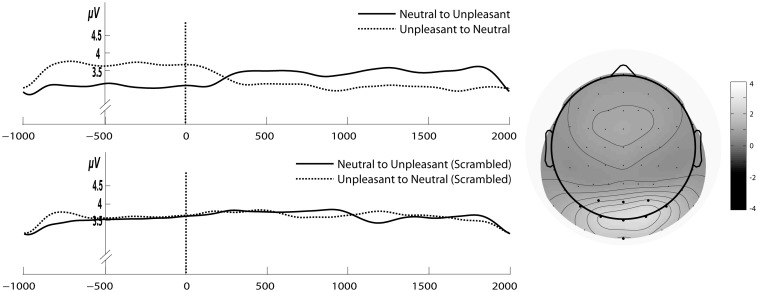
Fig. 8.
Left: Gabor filtered time course of SSVEP amplitudes for the stream of concrete (upper panel) and scrambled (lower panel) unpleasant and neutral pictures with change in emotional content. Time point zero shows the onset of change in emotional content. Right: The grand average of 6 Hz SSVEP amplitude across all subjects and conditions for the time period of 1 s before and 2 after the change in emotional content.

