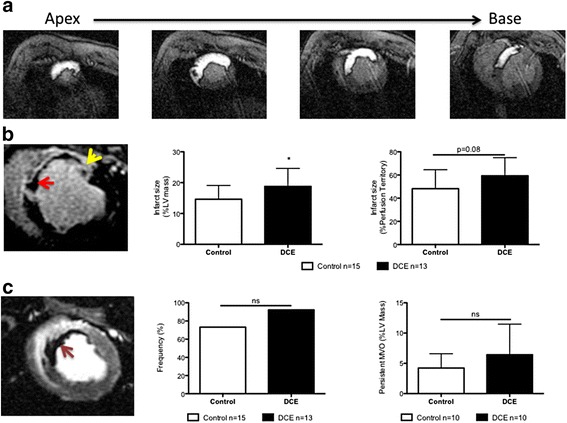
Fig. 4.

Baseline and 3d post-infarct CMR with gadolinium-DTPA. a. Baseline myocardial perfusion territory images (seen as white enhancement) of the mid LAD from apex to base. This territory represented 39 % of the overall left ventricular mass. b. LGE images showing regions of persistent MVO (red arrow) and infarct tissue (yellow arrow). Infarct size as a percent of total left ventricular mass (center) was significantly increased in DCE animals compared to controls (*p = 0.04) (Control n = 15; DCE n = 13). The DCE group also demonstrated an increased infarct size relative to the baseline perfusion territory at-risk (p = 0.08). c. EGE images depicting MVO (Left, red arrow). A non-significant increase in the proportion of animals displaying MVO (center) and persistent MVO (right) was observed in the DCE group
