
FIGURE 3:
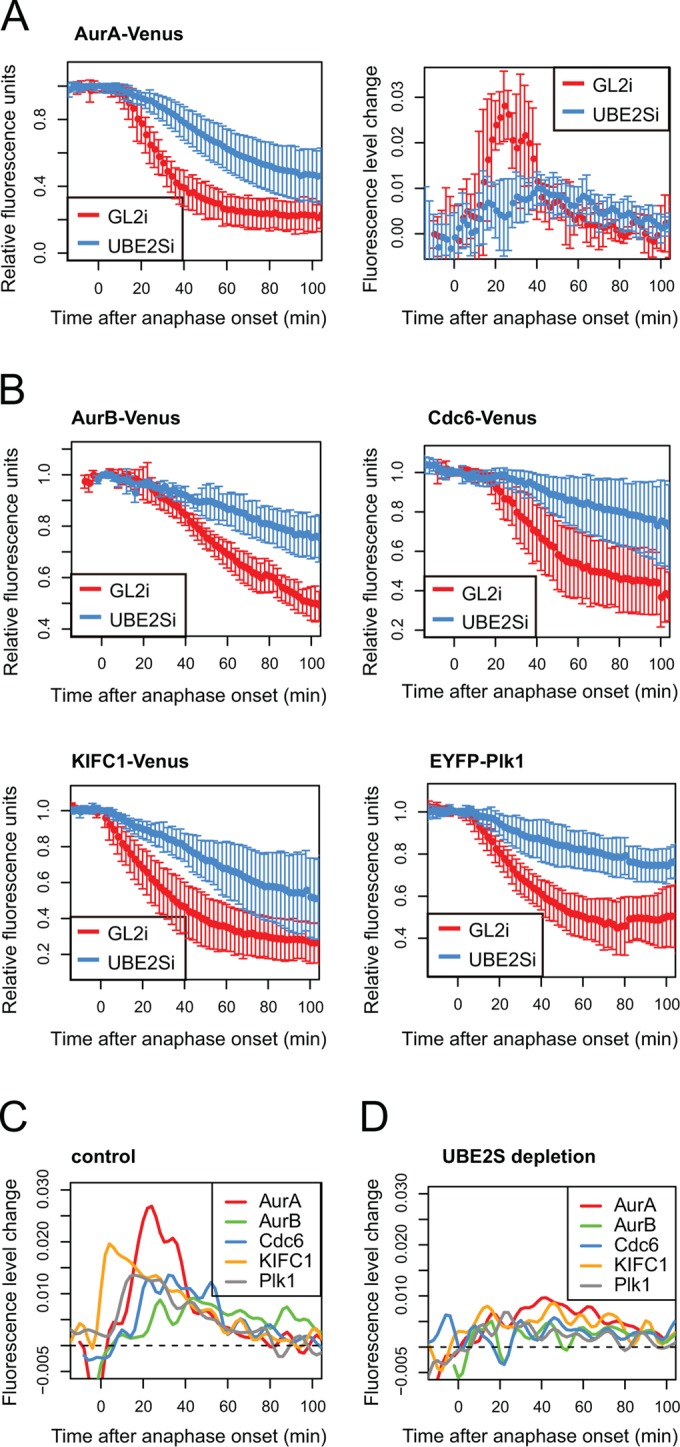
Efficient degradation of mitotic exit substrates requires UBE2S. U2OS cells were transfected with indicated constructs together with control or UBE2S siRNA and imaged by fluorescence time-lapse microscopy from 24 to 48 h after transfection. Fluorescence intensity of Venus over time, in individual mitotic cells, was quantified and plotted as a function of anaphase onset. (A) In vivo degradation curve (left) shows averaged intensities normalized to anaphase ± SD (n ≥ 5); degradation rate curve (right) shows the change in rate over time, derived from degradation curves as described in Min et al. (2013). (B) Degradation curves for indicated substrates under conditions of control (GL2i) or Ube2S knockdown (Ube2Si). (C) Degradation rate curves for mitotic exit substrates under control conditions. (D) Degradation rate curves for mitotic exit substrates after UBE2Si.