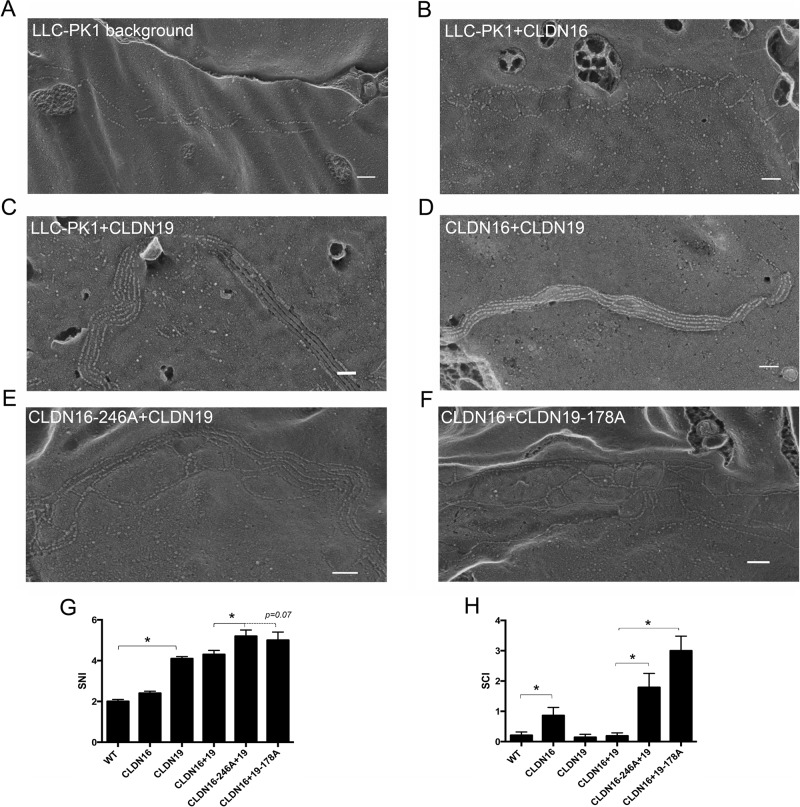
FIGURE 5:
Freeze-fracture images of claudin-transfected LLC-PK1 cells. Freeze-fracture electron microscopy revealed TJ ultrastructures in LLC-PK1 cells with no transfection (A) or LLC-PK1 cells transfected with claudin-16 (B), claudin-19 (C), claudin-16 and -19 (D), claudin-16-246A mutant with claudin-19 (E), or claudin-16 with claudin-19-178A mutant (F). Bar, 100 nm. Quantitative image analyses revealed TJ strand difference (G) and TJ complexity difference (H) among these LLC-PK1 cells transfected with claudin-16, -19, or their mutants. *p < 0.05, n = 7–9.

