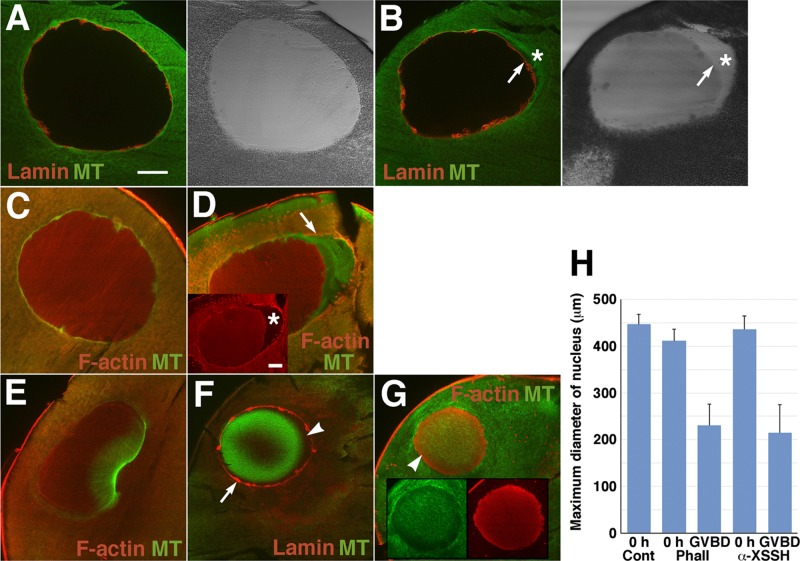
FIGURE 6:
Effects of phalloidin injection on intranuclear actin filaments and assembly of the MTOC-TMA. Midsagittal sections of immature oocytes (A–D) and oocytes after GVBD (E–G), injected with vehicle alone (control; A, C, E) or with 10 mM phalloidin (B, D, F, G), were double stained with anti-lamin (red) and anti-tubulin (green) antibodies (A, B, F) or anti-actin (red) and anti-tubulin (green) antibodies (C– E and G). Merged images and DIC images are shown. Inset in D, anti-actin staining alone. Insets in G, images stained by anti-tubulin (green) and anti-actin (red) antibodies. Arrows in B and F indicate the nuclear periphery stained by anti-lamin antibody. Asterisks in B and D indicate the yolk-free region. Arrow in D represents the cytoplasmic actin filaments surrounding the nucleus. Arrowhead in F indicates the unstained space where actin filaments might be present as shown by the arrowhead in G. (H) Maximum diameter of the nuclei of oocytes injected with vehicle alone (Cont, n = 6), 10 mM phalloidin (Phall; 0 h, n = 4; GVBD, n = 11), or anti-XSSH antibody (α-XSSH; 0 h, n = 4; GVBD, n = 5) before progesterone treatment (0 h) or at GVBD. The gross area was measured from each section (the section that had maximum area of nuclei was selected from serial sections) by ImageJ software, and the maximum diameter was calculated as a perfect circle.

