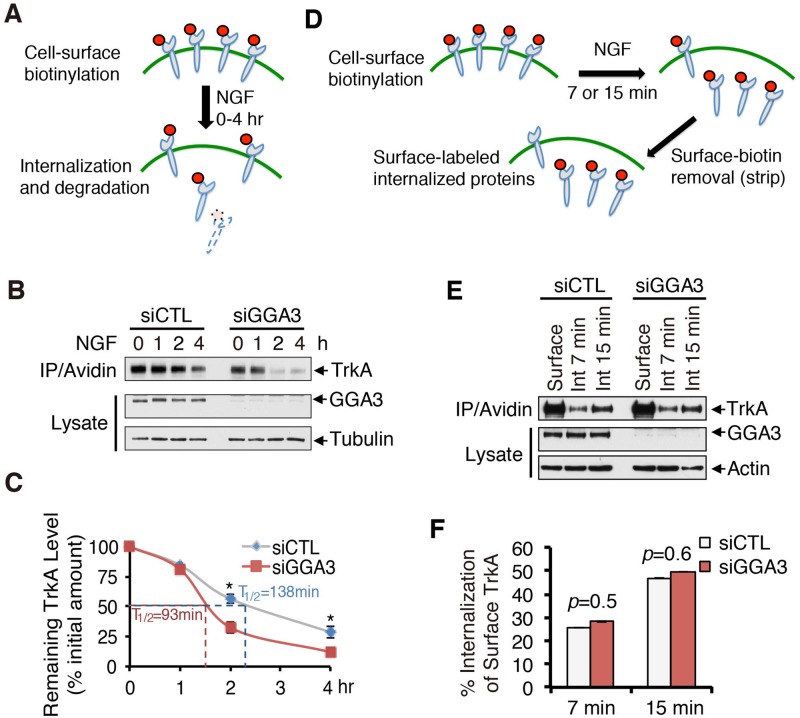
FIGURE 2:
GGA3 knockdown alters TrkA degradation but not its internalization. (A) Schematic of degradation assay. PC12 (615) cells were biotinylated at 4°C to label cell-surface proteins and stimulated with 10 ng/ml NGF for 0, 1, 2, or 4 h at 37°C to allow for internalization and degradation of biotinylated receptors. The remaining biotinylated proteins were collected with avidin and immunoblotted with TrkA antibodies. (B) Representative Western blots of the TrkA degradation assay performed in control and GGA3-depleted PC12 (615) cells. (C) Quantification of the degree of TrkA degradation from three independent experiments (as described in B). The amount of degraded TrkA is expressed as the percentage of the initial pool of cell surface–biotinylated TrkA (time 0). Student’s t test, *p < 0.05. (D) Schematic of internalization assay. PC12 (615) cells were biotinylated at 4°C to label cell-surface proteins and stimulated with NGF for 7 or 15 min at 37°C to allow for internalization. Any remaining biotin on cell-surface receptors was removed with glutathione treatment to assess only the internalized proteins and then collected with avidin and immunoblotted with TrkA antibodies. (E) Representative Western blots of the TrkA internalization assay performed in control and GGA3-depleted PC12 (615) cells. “Surface” refers to the total biotinylated cell-surface TrkA receptors in unstimulated cells not treated with glutathione; Int 7 min and Int 15 min refer to the internalized biotinylated receptors after stimulation with NGF for 7 and 15 min, respectively, and glutathione treatment. (F) Quantification of the degree of TrkA internalization from three independent experiments (as described in D and E). The amount of internalized TrkA is expressed as the percentage of the initial pool of cell-surface biotinylated TrkA (referred to as Surface in F). Student’s t test, *p < 0.05.

