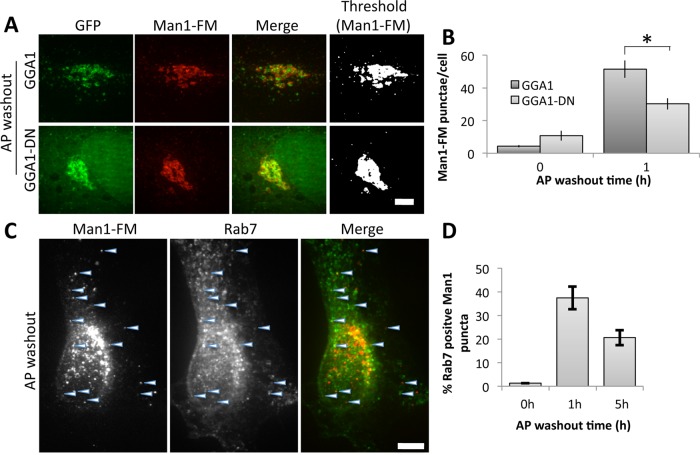
FIGURE 8:
GGA1-DN blocks Man1-FM trafficking. (A) Images show GFP fluorescence of GGA1 or GGA1-DN and anti-HA staining of Man1-FM after 1 h of AP washout. Thresholded Man1-FM staining is also shown. Bar, 5 μm. (B) Quantified number of cytoplasmic punctae per cell for Man1-FM at 0 or 1 h after AP washout (mean ± SEM, n = 3, >10 cells/experiment, *p < 0.05). (C) Cells were cotransfected with HA-tagged Man1-FM and GFP-tagged Rab7 and then treated with a 1-h AP washout. Images compare GFP fluorescence and anti-HA staining with arrowheads marking examples of costained punctae. Bar, 10 μm. (D) The percentage of total Man1-FM punctae counted that were positive for Rab7 is quantified for the indicated time points (mean ± SEM, n = 3, >10 cells/experiment, p < 0.05 for 0 h vs 1 or 5 h).

