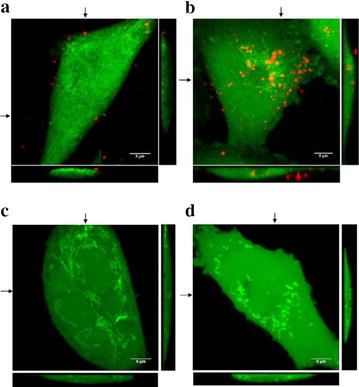
Fig. 4.

Localization of PKH26-labelled TMV (red fluorescence) in GC1415 cells (green fluorescence). Maximum intensity projection of three middle confocal planes are displayed. Confocal microscopy images of GC1415 cells exposed to TMV for 2 h (a) or 24 h (b) demonstrating plasma membrane attached (a) and internalised (b) TMV; TMV free control for PKH26 labelling for 2 h (c) and 24 h (d) are shown. A horizontal and vertical sections of the 3D images are also presented. Arrows indicates positions of each section
