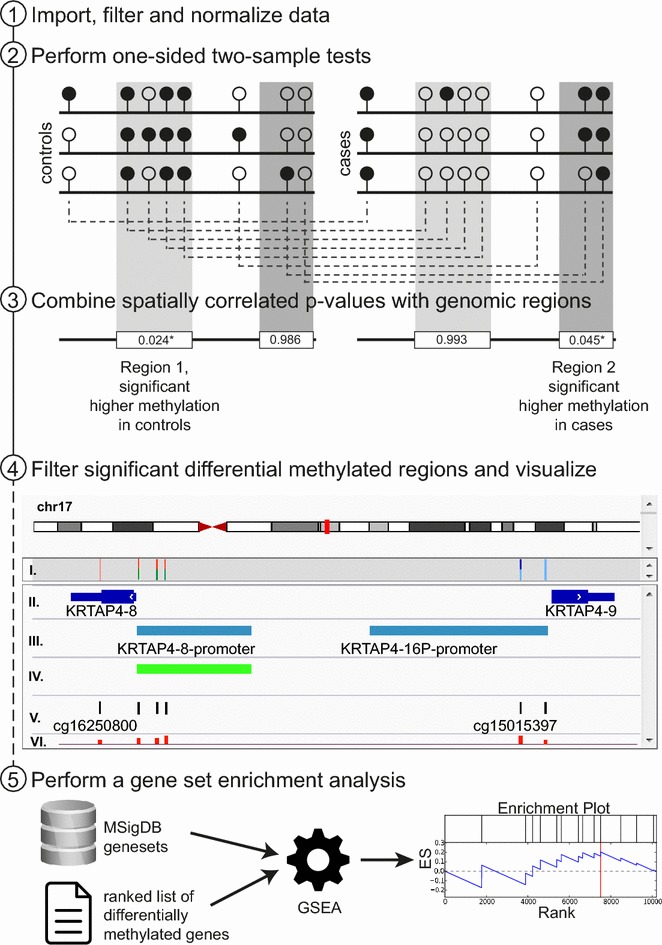
Fig. 2.

Workflow is illustrated on the left side as five steps. Step 2 Controls and cases are illustrated as replicates with methylated (black) and unmethylated (white) CpG sites. Single sites are compared between controls and cases (dashed lines). Step 3 Site-specific p values are combined into genomic regions and a representative q value is calculated for each region (light gray: higher methylation in control; dark gray: higher methylation in cases). Step 4 IGV screenshot of array visualization; tracks represent: (I.) single CpG site q values for two conditions with a color code, (II.) positions of known genes, (III.), selected regions of interest, (IV.) significant regions found by the pipeline, (V.) all probes represented on the array, and (VI.) bar plot track denoting absolute methylation change (up/down). Step 5 An optional gene set enrichment analysis (GSEA) can be performed using pre-defined or custom gene sets and ranked lists of differentially methylated genes
