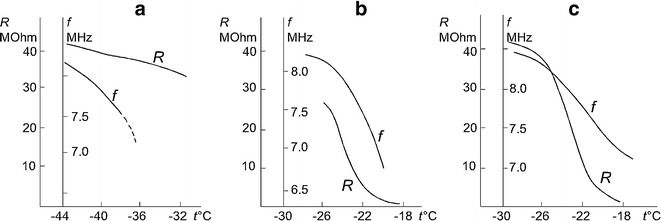
Fig. 4.

Comparative sensitivity of capacitive and resistivity sensors to the liquid phase in the frozen biologic at various time steps of the sublimation stage (explanation in the text). a Signals from the capacitive and resistivity sensors versus temperature under heating after 1 h of sublimation. b, c Signals from the capacitive and resistivity sensors versus temperature under heating at 11.5 and at 20.3 h of sublimation
