
Fig. 8.
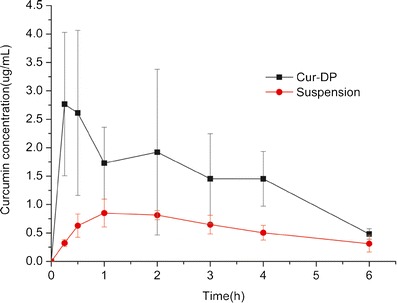
Plasma concentration-time profile of curcumin in rats after oral administration of curcumin suspension and Cur-DPs (mean ± SD, n = 5)
Official websites use .gov
A
.gov website belongs to an official
government organization in the United States.
Secure .gov websites use HTTPS
A lock (
) or https:// means you've safely
connected to the .gov website. Share sensitive
information only on official, secure websites.
Plasma concentration-time profile of curcumin in rats after oral administration of curcumin suspension and Cur-DPs (mean ± SD, n = 5)