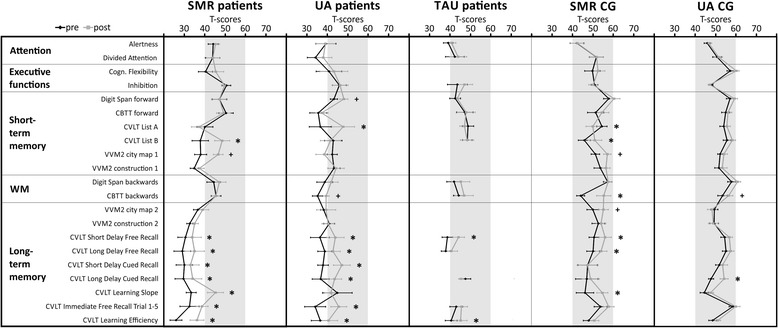
Fig. 3.

Test performance is expressed in T-scores with population mean M = 50 and standard deviation SD = 10. Group average test scores and standard errors for measurements of attention, executive functions, short- and long-term memory, and working memory (WM) performed during the pre- and post-assessment are depicted separately for stroke patients and healthy controls. Significant differences between pre- and post-test (critical difference analysis on the group level, [45, 46]) are marked with asterisks (*significant, +marginally significant). CBTT, Corsi Block Tapping Test; CVLT, California Verbal Learning Test; VVM, Visual and Verbal Memory Test
