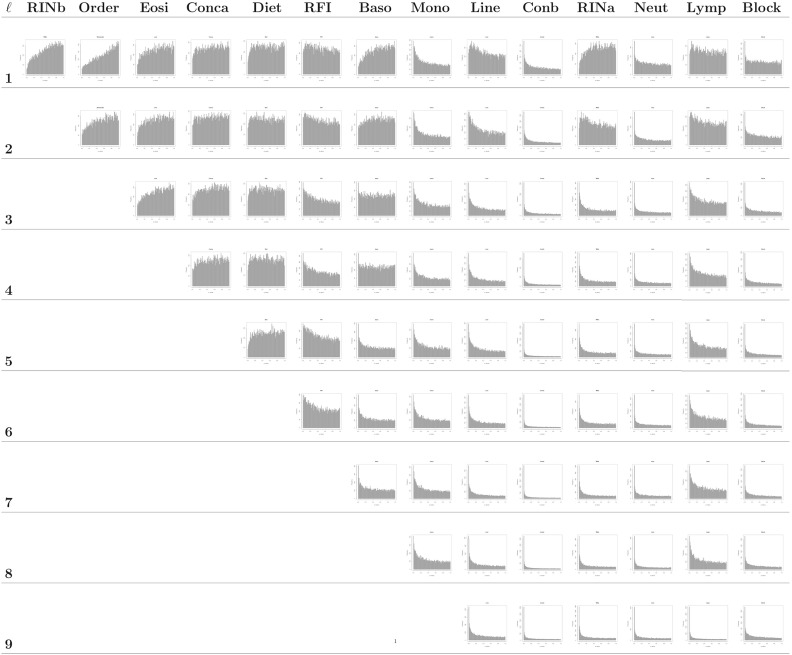
Fig. 1.
Histograms of p-values at each iteration of the backward selection procedure applied to the RFI RNA-seq dataset using the number of p-values less than 0.05 (p.05) as the measure of covariate relevance. Rather than using a common upper limit for each histogram’s vertical axis, the upper limit varies across histograms to accommodate the height of the tallest bar in each histogram. Using variable upper limits makes it easier to see differences between the histogram shapes of relevant and irrelevant covariates.

