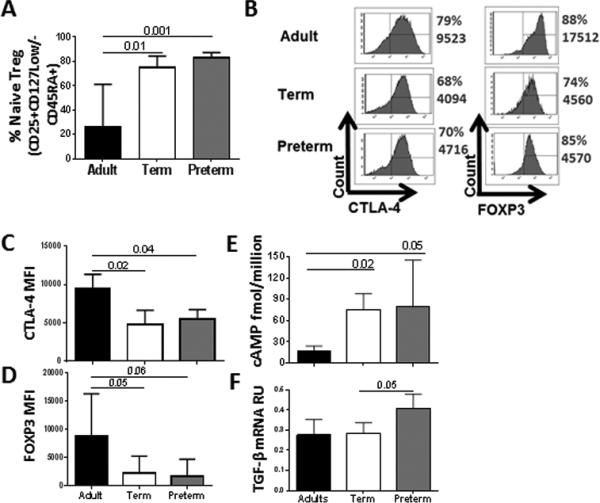
Figure 1. Activated Tregs from preterm and term neonates express lower FOXP3 and CTLA-4 than adult Tregs, but contain higher levels of cAMP.

Percentage of resting Tregs expressing CD45RA+ within the Treg-cell population (CD4+CD25+CD127Low/) was determined by flow cytometry. (A) Percentage of naïve Treg cells in peripheral blood from adults (n=7) and cord blood from preterm (n=7) and term (n=11) neonates.
(B-F) Tregs from preterm (n=7) and term (n=6) neonates were isolated by cells sorting and activated with CD3/CD28 beads. Adults (n=6) were included as control group. (B) Intracellular CTLA-4 and FOXP3 expression in Treg was determined by flow cytometry. Histogram figures from one representative experiment of four independent experiments from each group of donor show the percentage and MFI of CTLA-4 and FOXP3 in Treg post-activation. (C) CTLA-4 and (B) FOXP3 expression was quantified by flow cytometry in four independent experiments. (E) cAMP concentration was determined by ELISA. Data from one experiment performed are shown. (F) TGF-β mRNA level was determined by qPCR. Values were normalized to ubiquitin-conjugating enzyme. Data from one experiment performed are shown. (A-F) Significant differences between groups were calculated using Kruskal-Wallis test. Bars graphs show the median and interquartile range.
