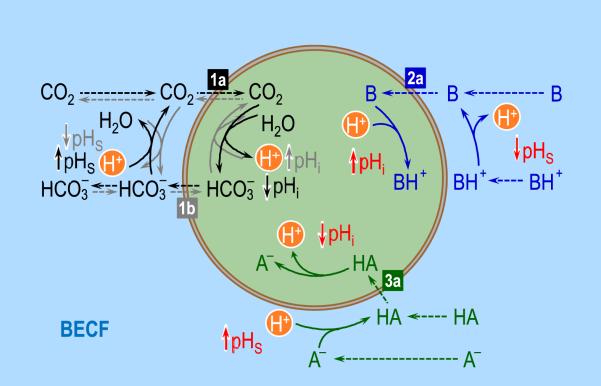
Fig. 7.
Interactions among acid-base equilibria. On the left, the black solid arrows (representing reaction) and dashed arrows (representing diffusion) show the consequences on intracellular (pHi) and surface pH (pHS) of the diffusion of CO2 into the cell (label “1a”), down a CO2 concentration gradient (i.e., [CO2]o > [CO2]i). The gray arrows show the consequences on pHi and pHS of the entry of HCO3− into the cell (label “1b”). At the upper right, the blue arrows show the consequences on pHi and pHS of the diffusion of a neutral weak base B into the cell ([B]o > [B]i; label “2a”). Although we do not show the consequences of the entry of BH+, these would be opposite to those produced by the entry of B. Finally, at the lower right, the green arrows show the consequences on pHi and pHS of the diffusion of a neutral weak acid HA into the cell ([HA]o > [HA]i; label “2a”). Although we do not show the consequences of the entry of BH+, these would be opposite to those produced by the entry of B. BECF, bulk extra-cellular fluid.

