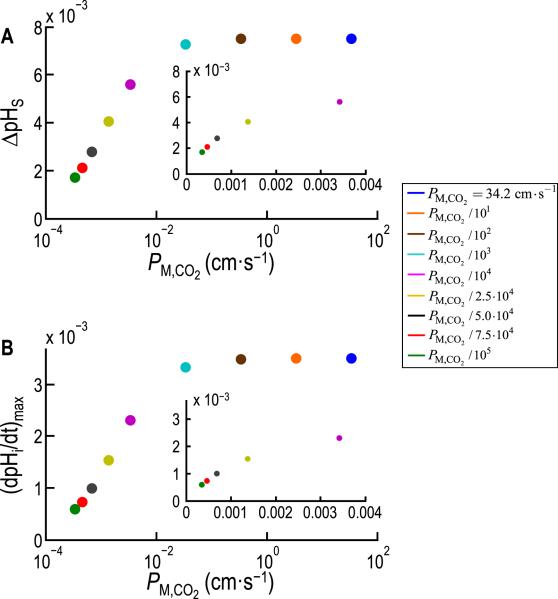
Fig. 9.
Dependence of ΔpHS and (dpHi/dt)max on the permeability of the cell membrane to CO2 (PM,CO2 ), predicted from the model of Somersalo et al. (2012). A: Maximal excursion in the pHS transient, ΔpHS (see Fig. 8B, upper), as a function of PM,CO2 for nine simulations in which PM,CO2 decreases from 34.20 cm s−1 (value predicted from the diffusion constant of CO2 in water) to 34.20 × 10⁻⁵ cm s−1. B: Maximal rate of intracellular acidification, (dpHi/dt)max (see Fig. 8B, lower), as a function of PM,CO2 for the same nine simulations reported in A. The two insets are linear re-plots for the five lowest PM,CO2 values. Modified from Fig. 7 in Somersalo et al. (2012).

